Multimodal Market AI — synthetic demo
Deterministic signals and a visual signal from a chart image are fused into one row per decision. Everything on this page is fake data, generated by open-source code.
The pipeline
synthetic OHLCV
      |
      +------> deterministic signals -----+
      |                                   |
      +------> chart image -> mock visual-+
                                          |
                                          v
                                     fusion table
                                          |
                                          v
                                  LONG / WAIT / SHORT
Fusion table
One row per decision. Every input already existed at the decision time; future outcomes are never used as inputs.
| Case | Decision time (UTC) | Trend | Momentum | Structure | Visual score (mock) | Visual signal | Deterministic | Decision |
|---|---|---|---|---|---|---|---|---|
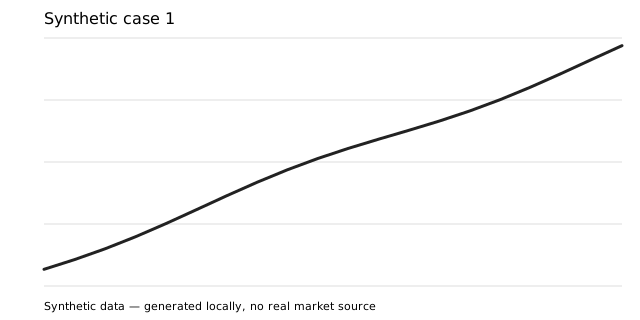
| case_001 | 2026-01-02 05:00 | +1 | +1 | +1 | +0.0188 | +1 | +1 | LONG |
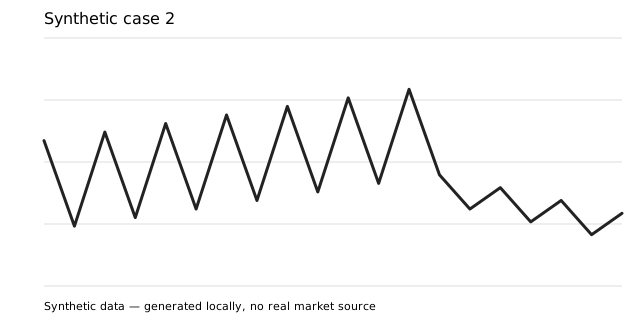
| case_002 | 2026-01-03 11:00 | 0 | 0 | -1 | -0.0024 | 0 | -1 | WAIT |
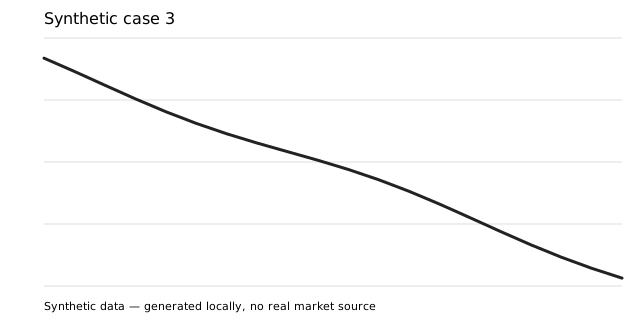
| case_003 | 2026-01-04 17:00 | -1 | -1 | -1 | -0.0188 | -1 | -1 | SHORT |
Swipe the table sideways to see every column, including the final decision.
Reading the signals: +1 means a rule points one way, −1 the other way, and 0 means that rule is not voting. A final LONG or SHORT needs the deterministic result and the visual signal to agree; otherwise the decision is WAIT.
The three chart images
The mock visual adapter
In a real setup, a vision model would look at each chart image and answer with a direction.
Here a small stand-in plays that part, so the demo runs anywhere with no model and no GPU. It
does not read the image: it measures the price change over the last 12 closes
(mock_visual_score) and turns it into +1 above +0.3%,
−1 below −0.3%, and 0 in between. A real model would
fill the same visual_signal column. It would first have to show that it adds
information over a plain deterministic baseline.
Why it is built this way
- Each row has a stable identity and a decision time.
- Unavailable data is not invented.
- Deterministic, numerical and visual sources stay separate enough to audit.
- A visual model is optional: it has to prove it adds information over a plain baseline.
Latest public research snapshot
An October 2026 large-sample arena evaluated 5 open VLM configurations × 1,000 frozen cases, producing 5,000/5,000 valid outputs across two 500-case tranches per model.
- Qwen3-VL 8B had the strongest Task A agreement with the deterministic comparison reference: 0.603.
- Task B remained difficult for every candidate; the highest observed agreement was 0.496.
- The comparison reference is an anchor, not ground truth, and the private task meaning remains closed.
- The two tranches were stable and an independent recomputation found zero discrepancies in the published aggregates.
Read the full public-safe arena report.
Get the data and the code
- Source code on GitHub (Apache-2.0)
- Synthetic dataset on Hugging Face
- Raw files for this page: fusion_table.csv, market.csv